In our previous post, we discussed trends in the venture capital industry for the year 2017 based on publicly available data. To dig deeper we decided to use our own data to discuss one of the more prevalent topics of 2017: liquidity. An early glimpse at the acquisition market in 2017 indicated that this was another strong year for the venture industry. Using our proprietary database, the Mine, we pulled out some of our findings from the year that was.
Another Active Year of Acquisitions
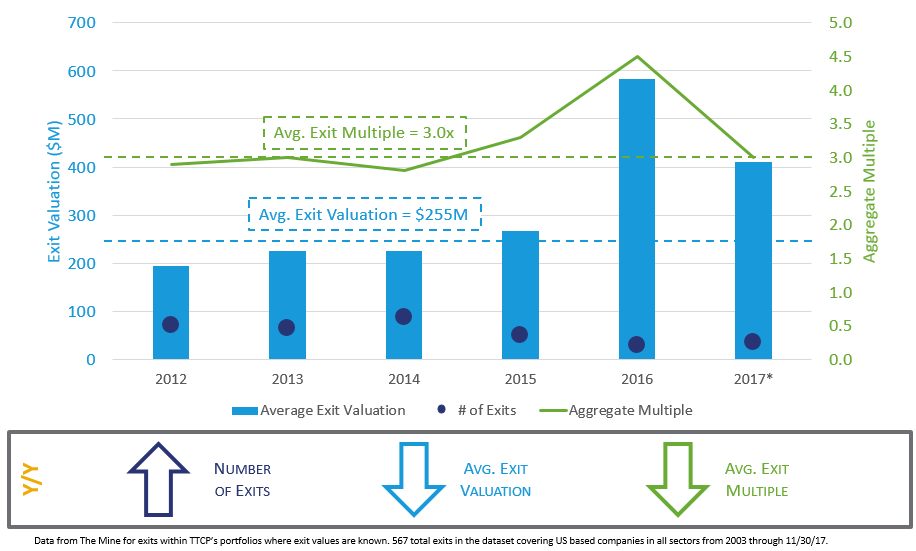
To delve into the acquisition data, we filtered our data set to include exits which were not the result of a public share sale or write-off. From 2003 to 2017*, 567 companies were acquired within TTCP portfolios. We were pleasantly surprised to find that the exit environment in 2017 was quite healthy.
The number of exits in 2017 increased from 2016, but the average exit price decreased slightly. While 2017’s average exit price was down from the year before, at $411m it was approximately 60% greater than the average since 2003. The most surprising decrease in the year over year statistics came in the average dollar weighted multiple of acquisitions which in 2017 was 3x, down from 4.5x in 2016. As TTCP is primarily investing in early stage venture, the results are skewed towards those VCs who invest early and follow-on in later rounds to maintain ownership. We believe VCs returning an average of 3x on acquisitions can ultimately meet our underwriting criteria as long as each fund contains some outliers to offset the inevitable write-offs and return 2.5x – 3.0x net to LPs.
Strong Companies Getting Acquired
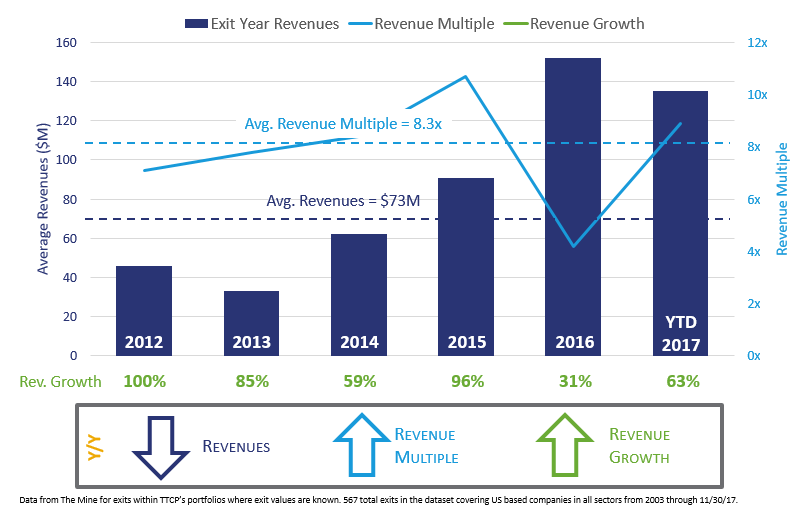
The exit data from 2017 begs the question of quality – were these strong companies exiting or those which had no other option? In an attempt to answer this question, we looked at revenue figures of the companies acquired in 2017. If the company was acquired in the first quarter, we looked at the prior year revenues; otherwise we used the current year revenue projections.
For 2017, the average revenue multiple at exit was a healthy 8.9x: up from an unusually low 4x in 2016 but on par with the 8.3x average multiple since 2003. Interestingly, the step up in multiple is accompanied by average revenues of $140 million, nearly double the $73 million average since 2003. Additionally, revenue growth from 2016-2017 for our data set was at 63%. This indicated to us that many companies have matured into their previously lofty valuations.
Translating Exits to Liquidity
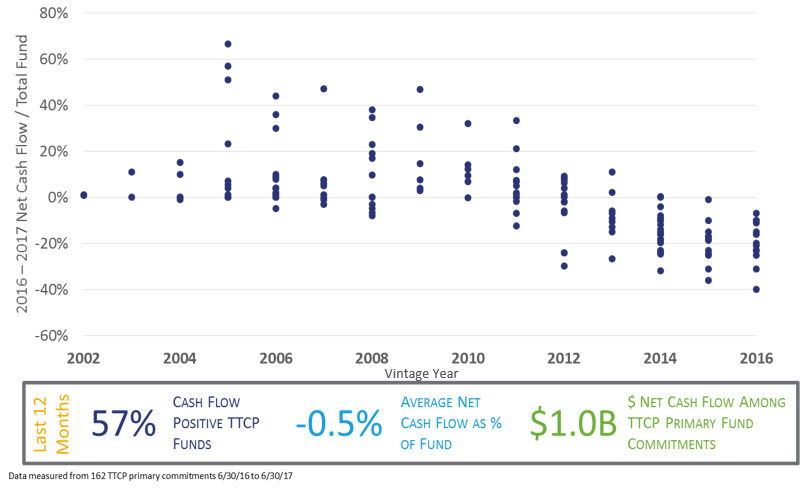
As LPs there is no guarantee that we will receive proceeds when an underlying GP sells their stake in a company, or the whole company, as the proceeds can be recycled for future investments or a portion can be distributed to the GP for carry. We were delighted to see that among our 162 primary commitments since 2002, 57% of the VCs distributed more than they called in the period June 30, 2016 to June 30, 2017. Of the funds to which we made commitments between 2002 and 2012 vintages, 83% distributed more than they called. This is a positive headline for our industry. Going forward, the hope is that this continues.
Liquidity May Bring a Dilemma
LPs like TTCP typically appreciate the return of their capital. However, that brings the added burden, albeit a nice one to have, of where and how to reinvest that money. As a fund of funds, we send cash back to our LPs and they then determine whether to reinvest in the asset class or utilize the cash to fund other initiatives. With a tremendous amount of money flowing into the venture capital industry from both capital reinvestment and new venture commitments, does all of this liquidity exacerbate the problem? A topic for another blog post…
*Data through 11/30/17