Reading the press these days could make one feel like the IPO window is closed and companies are struggling after they go public. Top Tier Capital Partners has long believed that early stage private market investing is where the real money is made. Over the last few years, however, we’ve invested more in the later stages as data has shown still meaningful gains at IPO. While it feels like the markets are more volatile these days and recently public stocks are struggling, the median gains over the three to six months from private valuation to IPO is almost 200%1. In cases where there are discretionary write-ups from the last private round to the quarter before IPO, the gains may be even higher vs. the prior round of investment. Revenue growth is still very high and revenue multiples are above average, but not as high as 2020.
Top Tier Participated in 70% of the VC-backed Tech IPOs in the U.S.
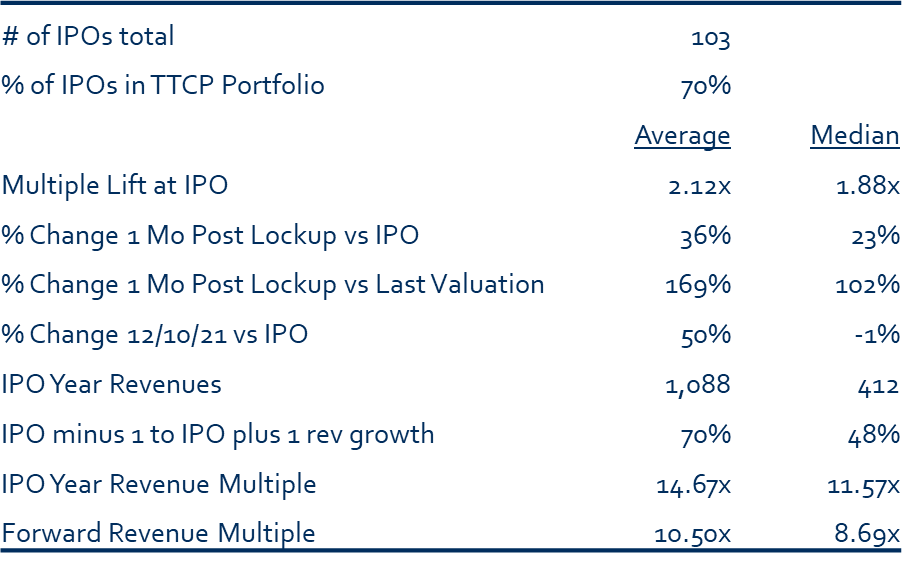
According to Crunchbase, there were 103 venture-backed US tech IPOs between Jan 1, 2019 and Dec 10, 2021. Top Tier participated in ~70% of these either directly or indirectly (through our LP positions in venture funds). This high level of participation provides us with meaningful insights into these companies, such as revenues and valuations from their pre-IPO days. Our analysis below considers these companies in the quarter before IPO, at IPO, one month after lock-up expiry and at December 10, 2021 (where applicable). We used one month post lock-up as a way to equalize traditional IPOs (6 month lock-up), direct listings (no lock-up) and SPACs (6 months post deSPACing).
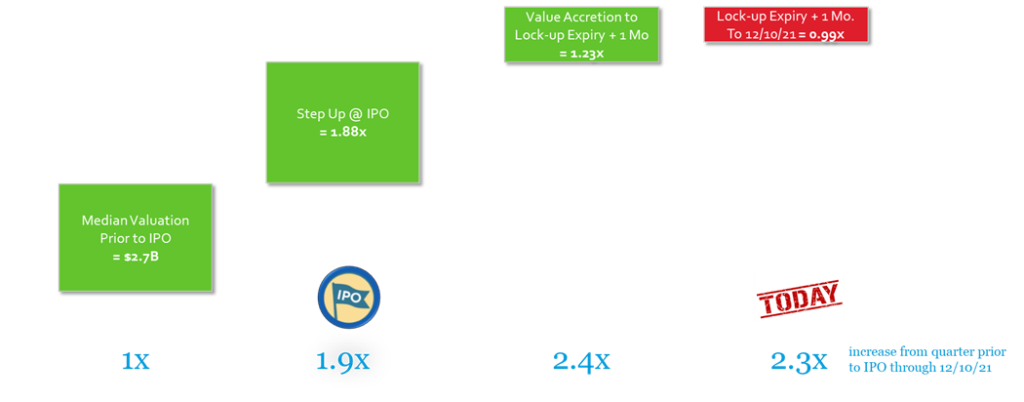
Despite the volatility in the public markets, venture-backed IPO valuations are 2.3x higher than those of the respective company valuations the quarter prior to IPO.
For many years, we have been telling investors that the bulk of the returns are made in the private markets vs in the early years post IPO. In fact, when considering TTCP’s aggregate IPO participation for this analysis, we find an average gross multiple on invested capital of 21x and median of 10x from investment to IPO. In the quarter prior to IPO, the median valuation for the pre-IPO companies considered in this study was a high $2.7 billion2. The median increase from that to the IPO valuation was 1.88x, implying valuations at IPO of about $5.0 billion. A question then, is how have these IPOs performed as public companies given all of this volatility of late? The median change from IPO to the one-month post lock-up data point is a 23% gain. At the December 10, 2021 “check point”, the declines from IPO were only 1% for those companies old enough to be included in the metric.
Companies have revenues of $412 million with ~50% growth.
For the 2020 venture-backed U.S. IPOs in which TTCP participated (directly and indirectly), the median and average revenues for companies in their IPO year are $412 million and $1.1 billion respectively, indicating a wide spread. These companies are growing revenues at a median of 48% when considering revenues at one year before IPO in 2019 versus one year after IPO in 2021. They are growng at an average of 70% over the three year period spanning the years before, during and after the IPO, from 2019 through 2021. Taking the median numbers observed, if a company grows at the same 48% for three years, the valuation will likely more than double during that time. At times, valuations for these fast growing companies may be priced off of expected revenues.
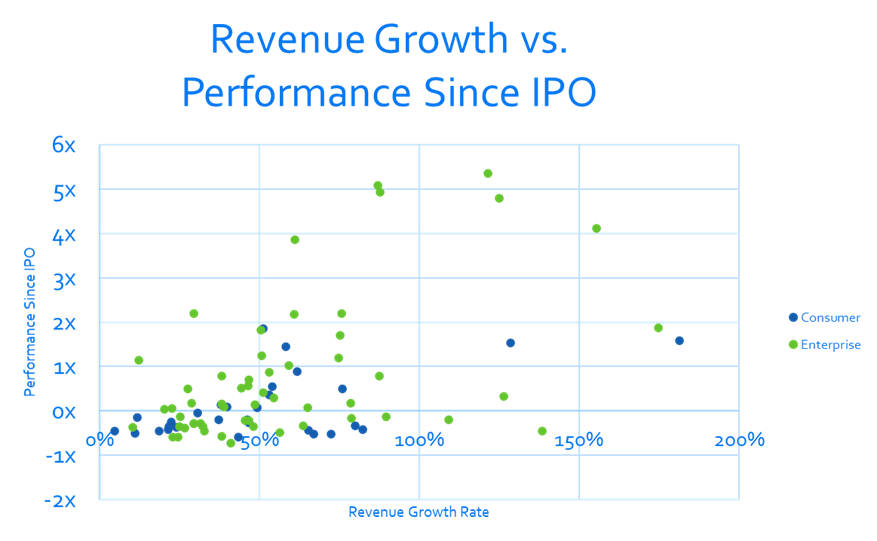
For companies with a greater than 50% growth rate, the median performance from IPO in 2020 to December 10, 2021, approximately one year post IPO, was a positive 67%. Conversely, for companies with growth rates below 50%, the performance represents a negative 25%.
2021 was an active and highly valued IPO year.
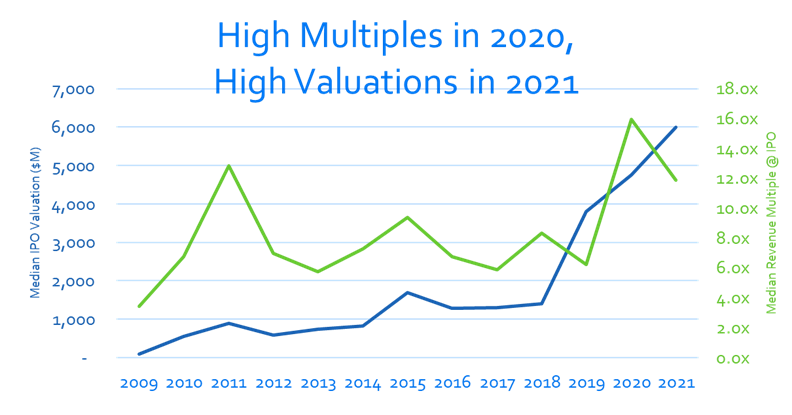
Over 60%, or 62 out of 103 of the IPOs included in this analysis of US tech IPOs from the period of January 1, 2019, to December 10, 2021, occurred in 2021. These 62 IPOs, in addition to some of those at the tail end of 2020, had some of the highest revenue multiples of this study. Median revenue multiples for the whole 3-year period were 11.6x. This is higher than the historical average, but with revenues growing at their current fast pace, when a company goes public – whether at the beginning or the end of the year – may impact the metric.
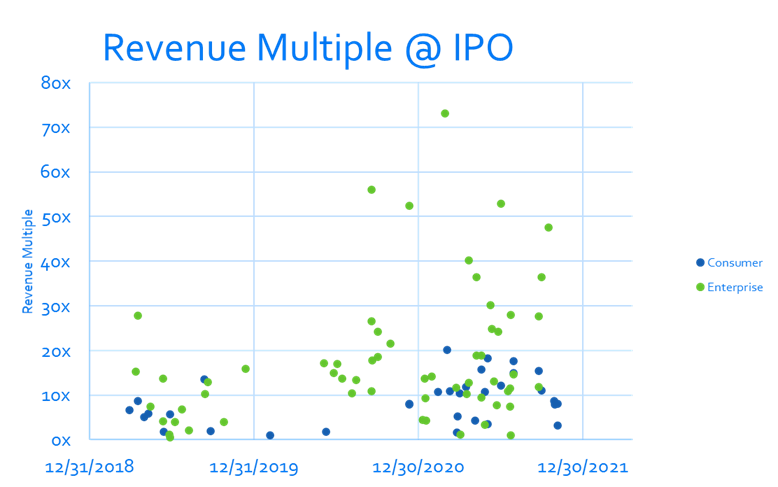
The data is skewed by some 2020 companies with greater than 15x multiples on relatively small revenues. Excluding these as outliers, the revenue multiple for 2020 declines to about 12x, in line with that of 2021. At times, public market investors look to the next year’s revenues when pricing fast growing companies such as these. With that in mind, the median revenue mutliples drop to 8.7x, which is slightly above the average of the last 13 years of median multiples at 8.3x. Therefore, we are cautious on valuations but are equally comforted that these companies could potentially grow into their valuations.
The last three years were very active for IPOs within the venture community.
Current valuations are high, but one could argue they are not overly expensive, assuming revenues and revenue growth assumptions hold up. Outcomes can change quickly in public markets, but we take comfort knowing that while valuations are growing, so are these businesses. Our view is that the markets are rewarding innovation, perhaps even more so during this current period and within the remote world in which we currently live.
Notes
Copyright © 2021 Top Tier Capital Partners, All rights reserved.
Disclaimer: Performance data for fund families are not audited. Individual investor performance may vary from reported fund or fund family performance because of such factors as the timing of subscription to the fund, foreign exchange, differing fund expenses or fees and the ability to participate in certain investments.
1: Companies included in this analysis include tech companies domiciled in the US, Europe and Israel that underwent a public markets listing during the period from January 1, 2019 through December 10, 2021. Source for companies included: Crunchbase. Source for valuations of private companies in which TTCP participated is TTCP’s “The Mine” internal database. Public equity prices and public company revenue data sources from Yahoo Finance as on 12/10/2021.
2: Data includes 57 IPOs where TTCP has data for valuations in the quarter prior to IPO