 As a fund of funds structure, we have the unique advantage of having a fairly broad lens into the venture industry, especially in the U.S. and Europe, and so we want to share some key findings with our partners like you. We are always happy to share analysis on a blinded basis should you need more on a certain topic. Please note the data presented in this newsletter is as of 3Q23.
SECTIONS
● Performance Benchmarking
● AI Revenue Multiples
● Dispersion of Returns
● Liquidity Solutions
● New Investments & Realizations
● What We Are Hearing
But first, a word about the data. Unless otherwise noted, the fund data presented here is for illustrative purposes only and has been sourced from our internal proprietary database that tracks TTCP’s portfolios, and therefore may not be representative of data within non-TTCP portfolios. The performance presented is net of the underlying fund level fees and expenses and is net of TTCP fees and expenses. Please see the disclosure notes at the end for more information regarding how the net of fee performance figures were calculated as well as other important information.
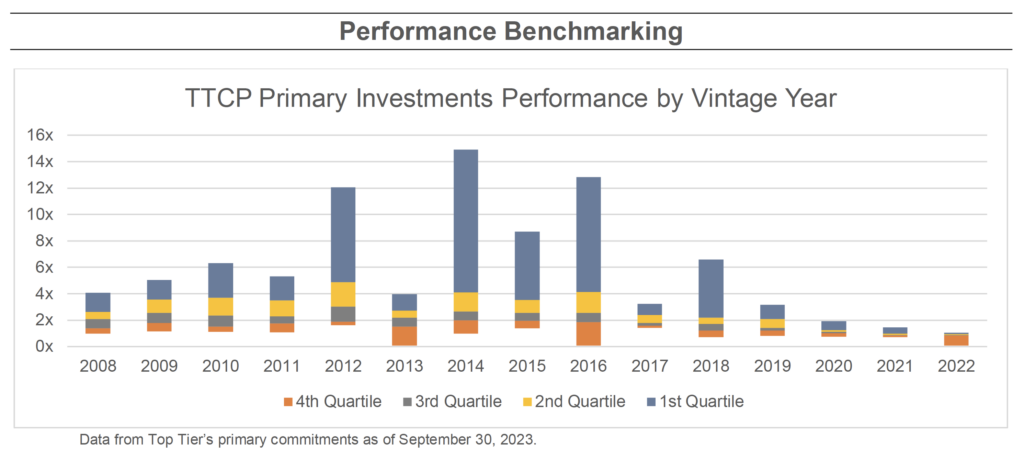 Summary: Over a 17-year period across a few market cycles, the average median performance is slightly above 2x, the upper quartile now slightly below 3x as opposed to being slightly above a 3x multiple.
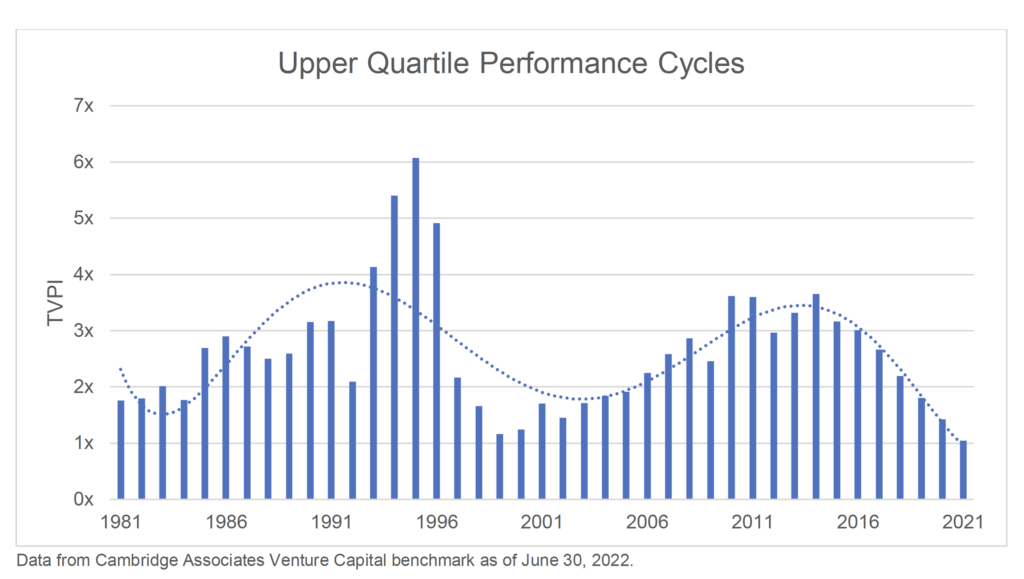
Summary: The average upper quartile TVPI is now 2.61x net, which is considered satisfactory under the assumption that long-term performance reverts to the mean. In comparison, this represents a decrease of 0.04x from the corresponding figures six months ago.
AI Revenue Multiples Around 10X
Our LP’s have been curious to know if this correction will look like the dotcom crash in terms of a long decade of lackluster performance that follows, or like the Global Financial Crisis (“GFC”) where the post-correction dip was shorter. Our belief is that all corrections are very different, from the run up, to the event and the subsequent bubble bursting. What we consider significant is what might pull us out of these downturns. In the case of the dotcom bubble, Google and e-commerce both became important players, allowing people faster access to information and goods. In terms of the GFC, open-source computing was instrumental in lowering costs for start-ups and other companies. Could artificial intelligence provide the lift we need now? Could AI help companies do more with less?
One way to assess whether smart investors think this is a viable sector is to examine how much they are willing to pay for these companies. Analyzing the revenue multiples on the AI companies in our portfolio, the median revenue multiple is 10x with an average of 18x. Median revenues are $23M and median valuations are $166M, possibly indicating these are real businesses with customers, but are not yet seeing billion-dollar valuations across the board. The graph below presents a smaller subset, that includes companies with estimated 2023 revenues, of which Top Tier alone has exposure to 378 companies, that are identified as AI in their descriptions1. Among these, the median age is 8 years, indicating that these are not new companies; rather, we have been living with AI for a considerable period.
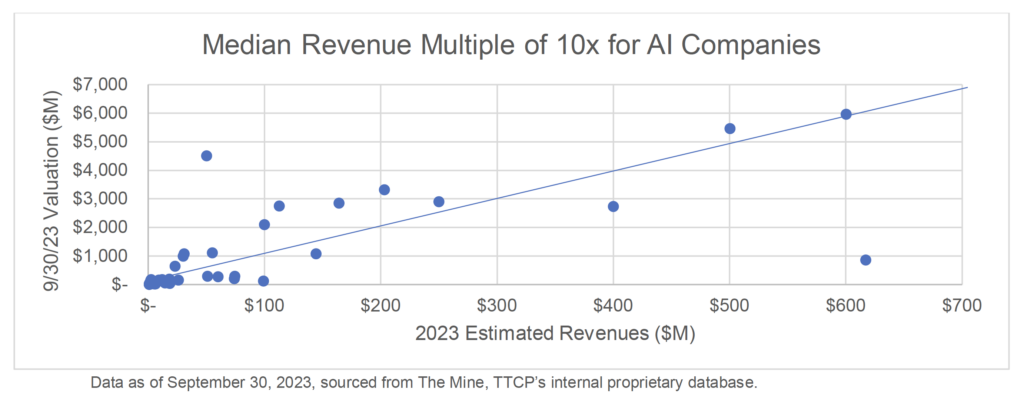
Summary: AI companies are everywhere and are turning into real businesses with real revenues. They’re poised to help companies do more with less, as is true with many innovative venture-backed companies.
Dispersion of Returns
What does the venture model look like in today’s world? The old verbiage that half of the startups fail and only 10% really matter is not far off the mark. We examined over 11,000 investments within our portfolios dating back to 2000 through to September 30, 2023 and found that 11% of the companies deliver 82% of the total dollars gained. More than half, 54%, of the investments are at or below 1x. However, in terms of dollars, only 14% of the total capital is in money losing investments.
As mentioned in previous newsletters, our analysis indicates that 85% of 3x funds include at least one company that is capable of producing the expected returns in the fund. On average, such funds hold approximately 10% ownership in such companies. These outliers are what keep us all investing in venture.
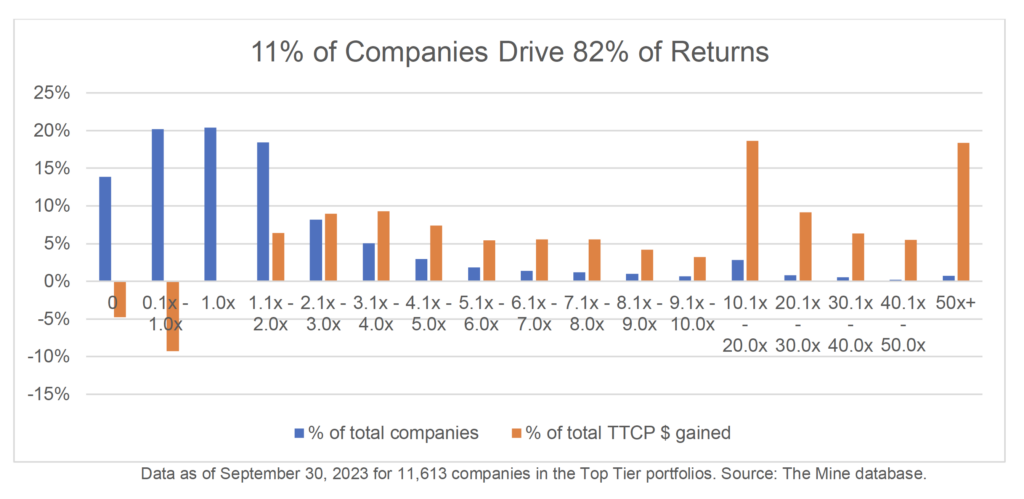
Summary: Over a 23-year period, a 14% loss ratio is lower than expected. Approximately 25% of the total gains resulted from 1-4x outcomes while 57% came from 10x or greater investments. Size does matter in venture.
Liquidity Solutions
While the previous deep correction was characterized by denominator problems and distressed sellers, leading to some very large discounts, the current correction is only producing stressed sellers. The typical seller generally falls into one of three categories: (1) a fully allocated investor with low liquidity but experiencing increasing capital calls and/or commitments as managers come back to market, (2) sophisticated investors looking to sell at a discount but redeploy that capital to high-growth investments where the total return exceeds the projected return if no action is taken, and (3) sellers who need to create liquidity.
As shown in the graph below, the discounts paid are fairly indicative of the market sentiment. Discounts are rising today because of volatility in markets and returns, combined with the lack of liquidity. Some buyers also believe valuations are still too high for several companies, and therefore attach a higher discount to cover for those valuation differences. Investors, whether LPs or GPs, are creating liquidity to meet their needs and financial thresholds. The good news is that the secondary market appears incredibly flush with cash and ready to transact. The first quarter is traditionally a trough in the seasonal cycle of secondaries as buyers are waiting for audited financials. We anticipate a similar trend in 2024, driven by the belief that more companies will face scrutiny from the auditors due to fewer financing rounds in the last twelve months. Consequently, some companies will now undergo options pricing model analysis during audits, whereas previously they could use the last round valuation.
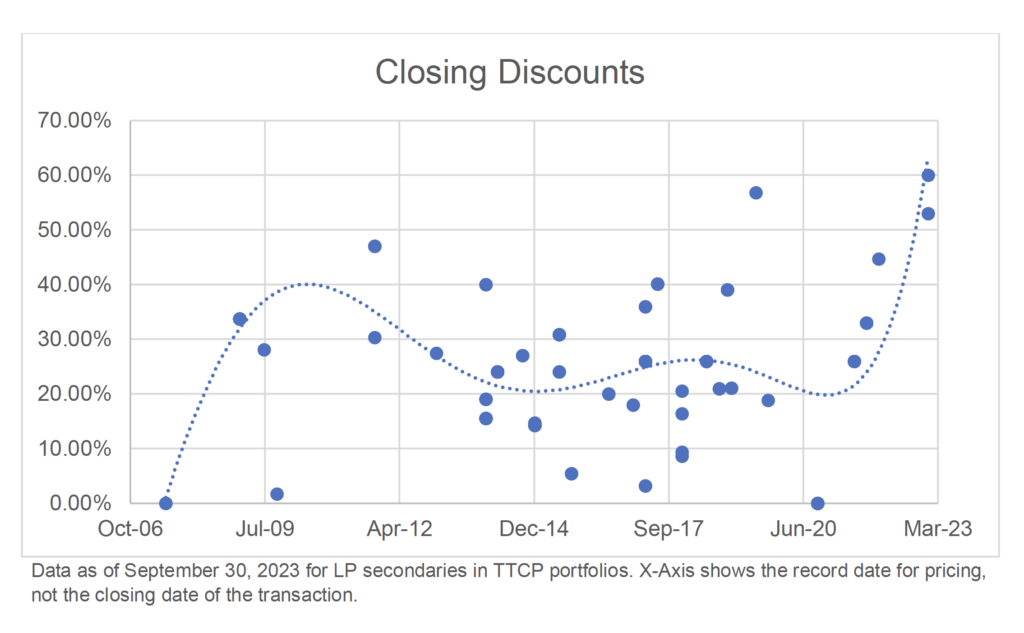
Summary: If sellers are not distressed like in the GFC, large discounts could indicate buyers’ views that valuations are still high.
New Investments and Realizations
During the early pandemic, ownership started declining while median valuations increased, all for similar investment amounts. However, as the graph below depicts, average ownership is continuing to increase again while investment amounts are steady, and valuations are slightly increasing.
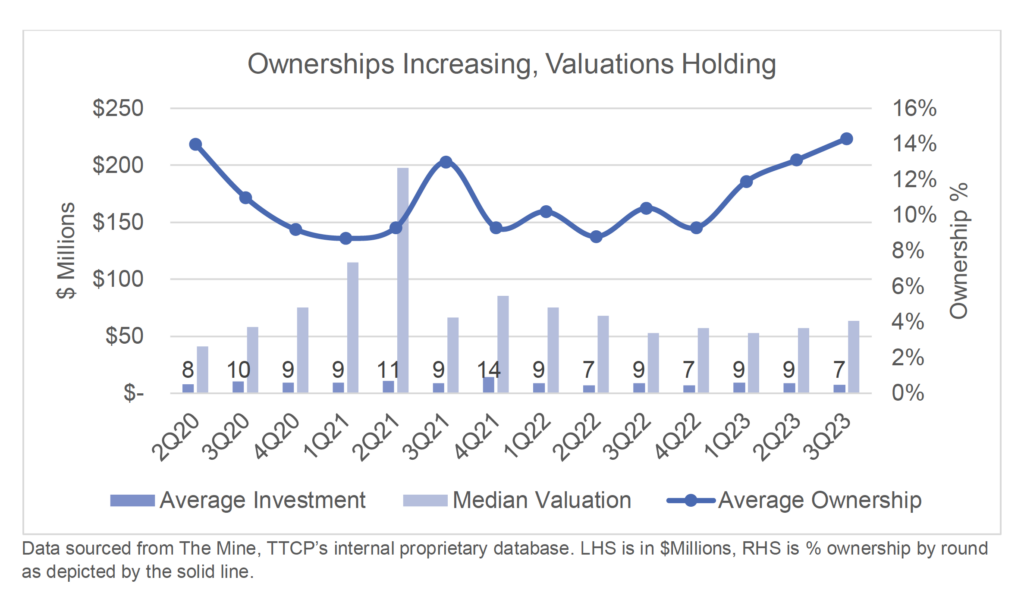 Summary: Ownerships, investment amounts and valuations all similar to early-pandemic and pre-bubble. Is this an indication the correction is nearing the end?
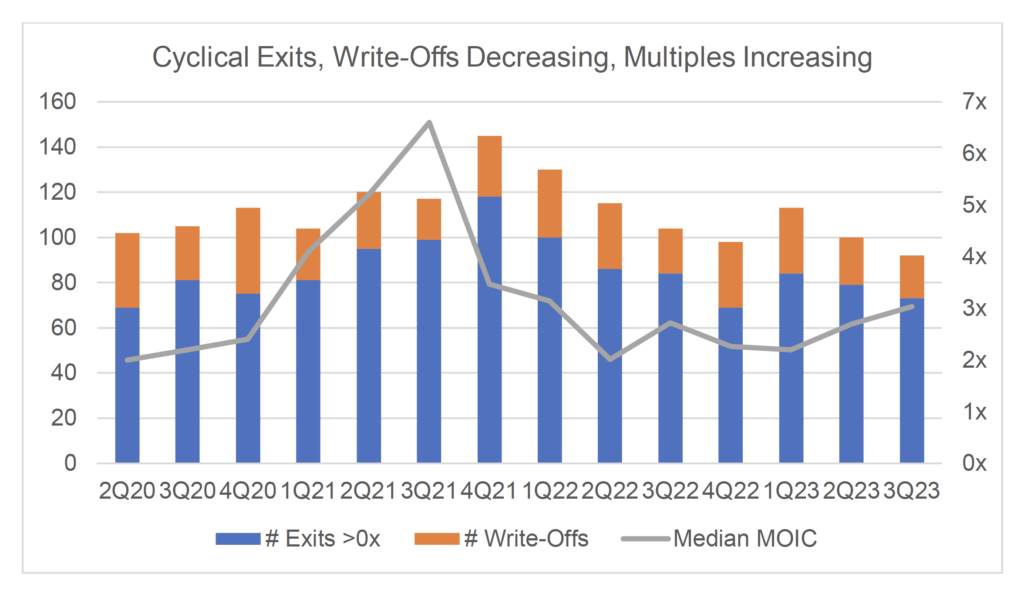
Summary: During the third quarter of 2023, exits continued, write-offs were similar to previous third quarters, and median MOICs are starting to trend upwards and above the levels at start of the pandemic.
What We Are Hearing
- Early September was a turning point for the venture industry in the US and Europe.
- Venture funds are deploying more capital in general, but growth / select / opportunities funds are doing so relatively slowly.
- Some managers are raising smaller funds by choice, but most are flat in fund size.
- 2024 will be a busy year for fundraising of venture funds as several funds initially scheduled for 2023, are expected to raise capital.
- By and large, LPs are staying the course, possibly with smaller allocations, but still committing.
- Secondary volume increased during 2H23 and into early 2024 as LPs, GPs and CEOs look for liquidity solutions.
- 3Q23 performance changes slowed dramatically.
- Early LPAC calls indicate some more write-downs in 4Q23 as companies hit the 1-year mark on the last round of financing.
- The general mood of our managers is trending positive.
Disclaimer: Top Tier Capital Partners, LLC (“TTCP”) provides this material as a general overview of the firm, our processes and our investment capabilities. It has been provided for informational purposes only. It does not constitute or form part of any offer to issue or sell, or any solicitation of any offer to subscribe or to purchase, shares, units or other interests in investments that may be referred to herein and must not be construed as investment or financial product advice. TTCP has not considered any reader’s financial situation, objective or needs in providing this information.
Performance data for fund families are not audited. Individual investor performance may vary from reported fund or fund family performance because of such factors as the timing of subscription to the fund, foreign exchange, differing fund expenses or fees and the ability to participate in certain investments. Data is net of managers fees and net of TTCP fees, calculated by taking the full fund gross-net spread to that fund’s underlying investments. The targeted investment allocations, internal rate of return, multiples and return of costs presented herein (the “Targets”) have been established based on several assumptions that may vary depending on the type of investment. There is no guarantee that the conditions on which such assumptions are based will materialize as anticipated and will be applicable to portfolio investments. Actual transaction conditions may differ from the assumptions used to establish the Targets and such differences could be material. A broad range of risks could cause the portfolios to fail to meet investment objectives and Targets, including changes in the economic and business environment, tax rates, financing costs and the availability of financing, regulatory changes and any other unforeseen expenses or issues. In addition, it is not possible to predict the outcome of regulation and/or enforcement initiatives in response to the economic crisis, and there can be no assurance that they will not result in changes that adversely affect our portfolios. Additional details about underlying assumptions are available to investors upon request.
The value of investments may fall as well as rise and you may not get back your original investment. Past performance is not necessarily a guide to future performance or returns. TTCP has taken all reasonable care to ensure that the information contained in this material is accurate at the time of its distribution, no representation or warranty, express or implied, is made as to the accuracy, reliability or completeness of such information.
This material contains privileged and confidential information and is intended only for the recipient/s. Any distribution, reproduction or other use of this presentation by recipients is strictly prohibited. If you are not the intended recipient and this presentation has been sent or passed on to you in error, please contact us immediately. Confidentiality and privilege are not lost by this presentation having been sent or passed on to you in error.
TTCP is registered as an investment adviser with the U.S. Securities and Exchange Commission. Registration of an investment adviser does not imply any level of skill or training.
Copyright © 2024 Top Tier Capital Partners, LLC All rights reserved.