The Pareto principle states that when thinking of cause and effect, 80% of the effect is driven by 20% of the cause. In our industry, this can be translated to 80% of the returns are driven by 20% of the funds or companies. As part of our portfolio construction efforts at Top Tier, we set out to test this and found it to be eerily accurate within our portfolio.
With the intention of determining what differentiates our top and bottom performing managers, we took those funds currently over 2.5x TVPI and those funds currently under 1.0x for all vintages 2012 and older. The data set comprises a total of only 26 managers (25% of our total primary funds older than 2012 vintage), but the results are clear. Regardless of performance, 18-22% of the companies within these venture funds return 80% of the value of that venture fund! The top performers had an average of 18%, while the bottom performers had an average of 22%. Due to the generally concentrated nature of our managers’ funds, this value is often held in three to five companies.
That’s where the similarities end between these two cohorts. Loss ratios were cut in half, the largest win (by value) in the portfolio was 50% larger and the multiple on the largest win (by value) was substantially higher for the top cohort, as compared with the bottom cohort. The table below shows these differences.
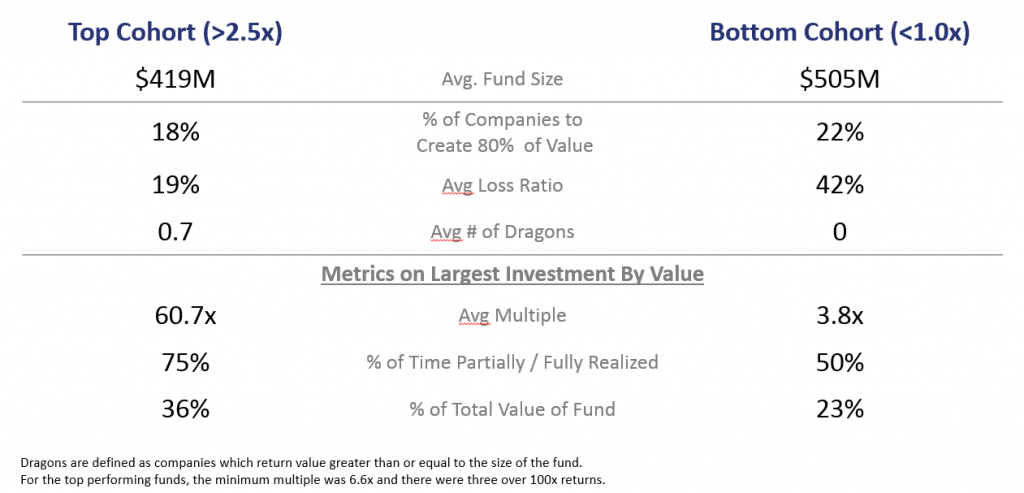
A key takeaway from this analysis is that loss ratios do appear to play a role in the performance of funds. Large losses require larger and rarer wins to offset. In all of the funds included in the Top Cohort above, the single investments with the largest single value return ranked in the top spots in terms of multiple.
For example, in all cases when we ranked the fund investments by value, that top company was also one of the top two multiples in the fund. This is a very important metric because a 2x return on a $50 million investment is different from a 6x return on a $10 million investment. Both are $50 million back to the fund, but the latter leaves more invested capital for other companies in the portfolio to create additional value. We found that these large value drivers were rarely the the result of piling money into a company and receiving a 2-3x return, but rather are ranked so highly because they were good investments yielding an outsized multiple and return.
Finally, we see dragons (companies which return value to the fund that is greater than the fund size) as being important to the creation of high multiple funds. In fact, 60% of our top funds have at least one dragon and no two funds share the same dragon. The rest have at least one “half-dragon” or company that can return half of the fund. In some cases, a fund has multiple companies fitting these definitions.
We should note that no dragon on our list appeared twice, perhaps indicating that ownership percents come in to play. All of the funds in the top cohort were in the top quartile for nIRR based on Cambridge Associates’ benchmarks*, but three fell into our second quartile when TTCP ranks against our opportunity set within a given TTCP fund.
In summary, the magic numbers appear to be 20% of the companies returning 80% of the value, keeping loss ratios to around 20%, leaving the other 60% of the fund to create the other 20% of the value. It sounds simple, right?
Cambridge Associates’ U.S. Venture Capital index and benchmark statistics are based on data compiled from over 1,600 institutional-quality venture capital funds formed between 1986 and 2016. TTCP-managed funds do not mirror such index and the volatility may be materially different than the volatility of the index. Based on Q3’16 Cambridge benchmarks.