Einstein once said not everything that counts can be counted.
At Top Tier Capital Partners, we often look towards the horizon to understand the long-term and peer at spreadsheets to analyze the short-term. And often, we find an interesting pattern that makes us wonder, what should be counted?
The Delta: According to the National Venture Capital Association (NVCA), in 2013, $29.6 billion was invested in 3,995 venture-backed companies, yet only $16.9 billion was reported to be raised from institutional investors, a $12.7 billion difference. For 2011 and 2012, the pattern was more-or-less similar; there was a difference of $10.8 and $7.7 billion, respectively, between amount invested in companies and amounts raised by venture funds.
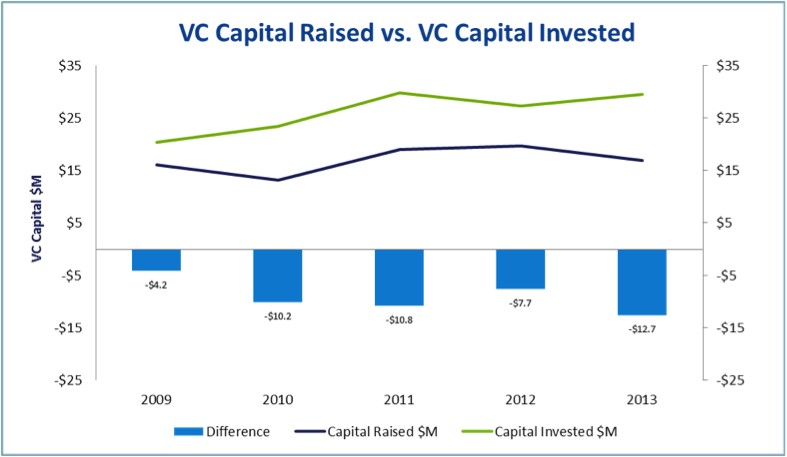
An Overhang? Previously, the ability to invest more per year into companies than what was raised was explained as working through the VC capital “overhang” or “dry powder” that built up after the dotcom bubble burst. But, given the relatively small amounts of capital that has been raised since 2009, this overhang for the most part has been absorbed. So where does the additional capital come from each year allowing VCs to invest significantly more than has been raised? And more importantly, what do the numbers look like as we gaze into 2014, given that the amount raised in 1Q14 according to the NVCA was $8.9 billion and the amount invested was $9.5 billion (both numbers showing considerable increases versus the past several years)?
Hidden Capital: The mystery of tracking this $13 billion difference creates some ambiguity for data analysts. The NVCA, Preqin, CB Insights, Pitchbook, VentureSource, and Thomson Reuters often rely on institutional investors (LPs) and fund managers (GPs) to report capital flows. However, these sources miss a number of very important sources of investment capital for venture capital-backed companies: mutual funds, corporations, and angels.
Mutual Funds, Corporations, and Angels: Blackrock, Fidelity, Janus, T. Rowe Price, and Wellington have all been active late stage investors in venture-backed companies over the past several years, investing in large and highly-valued rounds of companies like Airbnb, Dropbox, LendingClub, and Pinterest. According to a recent article by the WSJ, mutual funds invested in 16 deals in 2013, up from 9 in 2012 and 6 in 2011. So far in 2014, that number stands at 13, according to CB Insights.
Corporations have also been very active. One of the largest rounds in 1Q14 was Intel’s $750 million investment in Cloudera. This investment would not be in the fundraising data, but would be included in the investment data. Nor would Alibaba’s $215 million investment in messaging service Tango, or the $250 million round in rideshare company Lyft by Alibaba and Coatue Management, a hedge fund sponsor. Such mega-rounds now seem to be the norm for late stage companies with significant customer traction. At Top Tier Capital Partners, we expect this trend to continue as the IPO window remains open to venture-backed companies.
In addition, the seed investment patterns at the early end of the spectrum show angel investors abound; and we do not expect angel activity to slow anytime soon. A private company’s typical seed round of $1.5 million may see as much as 50% come from angel investors, many of which do not raise institutional capital and, therefore, would not be included in the fundraising statistics.
Capital Flow Implications: Data gathering and reporting of venture capital flows need to adjust to this new reality. Looking only at capital raised to determine the size of the venture capital industry, one would conclude that we have enjoyed a rational fundraising market over the past several years—one of the key inputs to a healthy market (the others in our view are a robust innovation cycle and sufficient liquidity market).
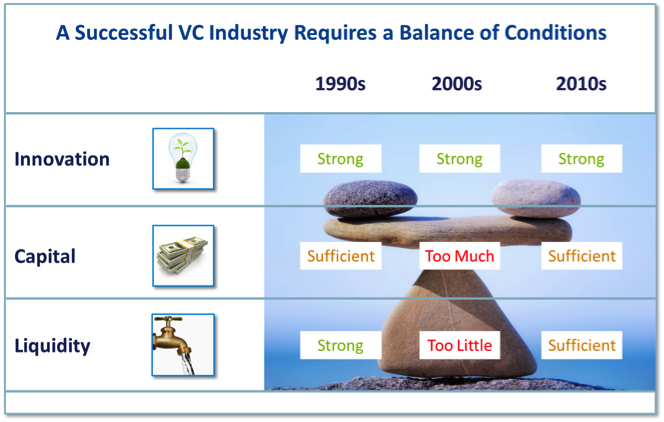
However, looking at the dollars invested over the past two years as well as the 1Q14 numbers for fundraising and invested capital, we conclude that investor optimism has increased considerably and capital is flowing once again into the venture capital sector as the strong IPO market and industry statistics show marked improvement.
Series A/B Opportunity. At Top Tier Capital Partners, we think the most inefficient market may now be the back-to-basics early stage where the Series A and B rounds are still under-capitalized. This gives superior managers who offer the most company building value-add, the opportunity to outpace expected risk-adjusted returns. Currently, it appears that the seed stage and later stage have plenty of capital available from new, non-traditional sources, some of which are not counted in the fundraising statistics, leading to a much larger market than many may realize.
What do you think? We welcome your views on the implications of these uncounted sources of capital and how they might affect the market. Please let us know via Twitter: @TTCP_SF.
Legal Disclosures
CERTAIN FACTUAL STATEMENTS MADE HEREIN ARE BASED ON INFORMATION FROM VARIOUS SOURCES PREPARED BY OTHER PARTIES. WHILE SUCH SOURCES ARE BELIEVED BY TTCP TO BE RELIABLE, TTCP DOES NOT ASSUME ANY RESPONSIBILITY FOR THE ACCURACY OR COMPLETENESS OF SUCH INFORMATION.
RECIPIENTS OF THIS DOCUMENT ARE NOT TO CONSTRUE IT AS INVESTMENT, LEGAL OR TAX ADVICE, AND IT IS NOT INTENDED TO PROVIDE THE BASIS FOR THE EVALUATION OF ANY INVESTMENT. RECIPIENTS SHOULD CONSULT WITH THEIR OWN LEGAL, INVESTMENT, TAX, ACCOUNTING, AND OTHER ADVISORS TO DETERMINE THE POTENTIAL BENEFITS, BURDENS, AND RISKS ASSOCIATED WITH ANY TRANSACTION INVOLVING ANY ISSUER REFERENCED HEREIN.
THIS DOCUMENT DOES NOT CONSTITUTE AN OFFER TO SELL OR THE SOLICITATION OF AN OFFER TO BUY ANY SECURITY; IT IS NEITHER A PROSPECTUS NOR AN ADVERTISEMENT, AND NO OFFERING IS BEING MADE TO THE PUBLIC. OFFERS TO SELL ANY INTEREST IN A TTCP-MANAGED INVESTMENT FUND SHALL BE PRECEDED BY DISTRIBUTION OF A PRIVATE PLACEMENT MEMORANDUM THE CONTENTS OF WHICH SHALL SUPERSEDE ANY INFORMATION PROVIDED HEREIN.