Venture Performance in the Era of Lean Startups and Continuing Innovation
Introduction
With the convergence of rapid innovation, right-sized amounts of capital, and improved liquidity, the venture industry has reverted to positive cash flow over the past two years. Returns are trending towards the mean of greater than 15% IRR (Internal Rate of Return) for the venture industry as a whole and more than 25% for the top quartile. Yet, this is just the beginning of a new wave of technological innovations in cloud computing, mobile devices, and the “Internet of Things”, which is estimated to have an economic impact of at least $900 billion a year in just manufacturing by 2025.
Trending to Higher Returns
For the first time since 2001, venture industry distributions in 2011 outpaced contributions – distributions reached $29 billion while contributions were $26 billion. In 2012, distributions reached $40 billion while $24 billion was contributed. The trend is anticipated to continue in 2013. As of the third quarter, 57 venture-backed companies have completed IPOs raising $5.8 billion, and 58 M&A deals have disclosed value of $9.2 billion.
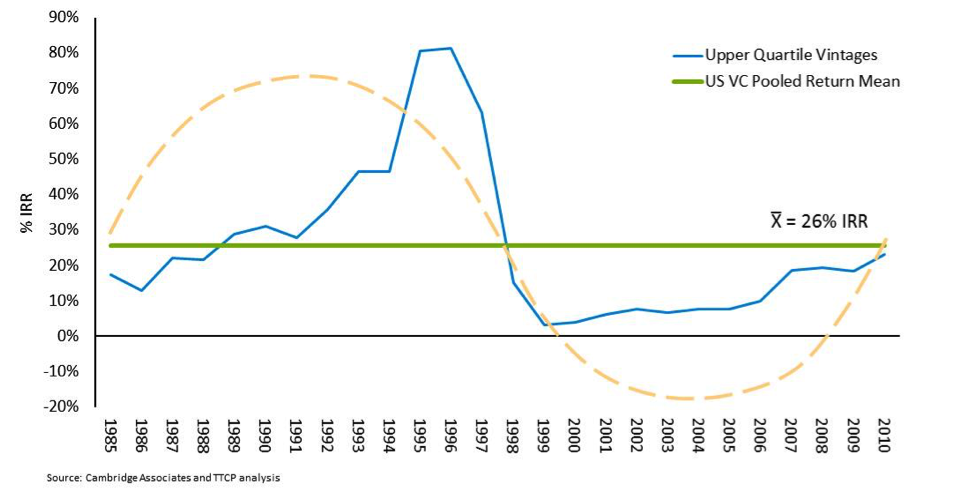
According to Cambridge Associates Venture Capital Index, upper quartile vintage year IRRs have improved by as much as 3x since 2002. The industry is trending towards a mean of more than 15% IRR for the venture industry as a whole and more than 25% for top quartile.
Returns Driven by Structural Technological Changes
The past decade has seen significant and rapid technological shifts occur in fundamental ways:
- Technology: in the technology sector, computing, memory, and storage costs have shrunk dramatically. These, combined with higher bandwidth speeds and robust networking infrastructure are bringing about change in every aspect of enterprise technology. Worldwide Internet users now exceed 2.77 billion, yet that is only 39% of the global population. Data, voice, and video are now an integral part of enterprise communication and consumption. Smartphones and Long Term Evolution (LTE) mobile networks have been the underlying drivers of disruption in the consumer arena. It is estimated that in 2014, mobile Internet revenues, at $259 billion, will account for more than 50% of total Internet access spend, overtaking fixed-broadband. As a result, the next decade is expected to spawn a new generation of wearable / anywhere computing devices, or the “Internet of Things.”
- Enterprise: In enterprise, technological changes and shared resources have launched pay-per-use models of computing. Market research reports estimate industry spending in cloud computing services to reach upwards of $100+ billion by 2017. The software industry has morphed from selling annual licenses to Software as a Service (SaaS) models. To accommodate the resulting deluge of data, analytics, and mobile applications, over $14 billion of market value is expected to be created. Over 140 million smartphone and tablet users access and consume data in myriad number of ways – commerce, social communication, travel, health and wellness – and this behavioral shift, combined with newer smarter devices, has created the next wave of opportunities.
- Healthcare: Healthcare sectors will also be impacted significantly with the onset of smarter devices. This sector attracts around 25% of total venture investments and is expected to grow over the next decade. Biotechnology and medical devices have been the primary sub-sectors of potential returns. With the passage of the Affordable Care Act (also known as “Obamacare”), ranges of new innovations are anticipated. Tracking of healthcare costs, quality, and patient wellness will change in the coming years. This will create opportunities for startups that will play in the trifecta of insurance: individual and employer mandates, Accountable Care Organizations (ACOs), and wellness programs. According to McKinsey reports, the potential economic impact of next-generation gene sequencing in healthcare, agriculture, and the production of substances such as biofuels could be $700 billion to $1.6 trillion a year by 2025. About 80 percent of this potential value could be realized from extendingand enhancing lives through faster disease detection, more precise diagnoses, new drugs, and more tailored disease treatments (customized both to the patient and to the disease).
These trends of cloud computing, mobility, and wellness have translated into numerous startup opportunities that have the potential to create venture-like returns. Such disruptions create new opportunities, which in turn drive rapid revenue growth and value creation for entrepreneurs and investors.
Innovation and the Art of Rapid Value Creation
While technological shifts create numerous opportunities, consider the following areas of greatest impact:
- E-commerce and shopping: Companies like One Kings Lane, Fab.com and Zulily are a few examples of new websites for online shoppers. These companies were launched only a few years ago, yet are now considered to be the hottest startups of the age. One Kings Lane, which offers home retail flash sales attracted 4 million members and reached $200 million in revenues in four years. Fab.com’s growth trajectory is similar with over 2.5 million users, 40% of which are mobile users and heading towards $100+ million revenues. Zulily, an ecommerce site for moms, reached more than $400 million in revenues in four years and was valued at $2.6 billion at its recent IPO.
- Travel and transportation: Airbnb, Uber and Lyft are the new disruptors, changing the way we make travel arrangements. The peer-to-peer sharing economy has two primary underpinnings – social profiles and mobile accessibility. In just four years, over 9 million guests have made reservations using Airbnb. Like Airbnb, Uber is a four-year-old venture backed company, which allows consumers to hire a black car service using their smartphone. It is valued in the private markets at $3.5 billion. Lyft, a ride sharing company, completed one million rides in just over a year from launch. The company recently raised $60 million from venture firm Andreessen-Horowitz.
- Media and entertainment: Increasing bandwidth speeds and mobility are impacting media channels (audio, video) and entertainment at an equally rapid pace. The gaming industry alone generated approximately $60 billion in revenues in 2012. Content creation, monetization, and distribution channels have been reinvented to meet changing demands. Consumption of content across multiple platforms (Android, iOS) and multiple devices (TV, tablets, smartphones) at various locations has become the norm, creating a new wave of investable opportunities. Companies like Netflix, Roku, Hulu, and Amazon.com have started to create and/or distribute content. Social media channels like Twitter influence video and TV viewership. LinkedIn is creating an impact on journalism and distribution as well. Both these companies completed successful IPOs and generated significant returns for venture investors.
- Education and wellness: The New York Times called 2012 The Year of the MOOC – massive open online courses. Thanks to increasing bandwidth, education technology trends are creating new ways for course creation, distribution, and student-teacher engagement. Technological developments allow for asynchronous engagement, anytime, at each student’s own pace, across geographic barriers and time zones. Venture-backed companies like Coursera (online education platform) and Chegg (textbook rentals) have brought efficiencies to the education marketplace. With the augment of low power blue-tooth devices, health and wellness trends have also created new opportunities for tracking individual health patterns. Companies like Fitbit and Jawbone are seen as category creators in the consumer digital health arena.
Other sectorial shifts have also occurred in enterprise software (big data processing and analytics, virtualization and storage), finance (with companies like Square, PayNearMe and Dwolla) and web security (with companies like Lookout). These trends continue to evolve and create a new set of venture opportunities, yet the present times and new venture model have minimized investor risk with lower points of failure.
Lean Startups and the Era of Capital Efficiency
Today, less capital is required to start companies and by parsing it out over multiple milestones, capital can be more efficiently deployed.

- Capital efficiency: The amount of capital required to start a company today has dropped 99% as compared to 20 years ago. Due to the advent of computation, network and storage available as utilities, a technology startup can be launched with as little as $5,000. Incubators and accelerators have trained the new generation of entrepreneurs to focus on customer acquisition and development of a “minimum viable product” (MVP). Thus, entrepreneurs are focused on attracting customers effectively as opposed to building feature-rich technology empires. This increased capital efficiency leads to lower investor losses.
- Lower points of failure: Thanks to capital efficiency, the points of failure in any startup’s trajectory can now be optimized by venture investors. In the past, it would take several million dollars to reach a meaningful point of inflection. Today the amounts are lower and thus product development, beta launch, customer adoption, scaling for growth and generating revenues are achieved with a much smaller capital deployment. Venture firms have fine-tuned the amount and timing of capital into technology companies to maximize returns.
Towards Improved Venture Returns
Smaller institutional capital flows into the venture industry, plus a vibrant exit market, imply better returns and vintages going forward.
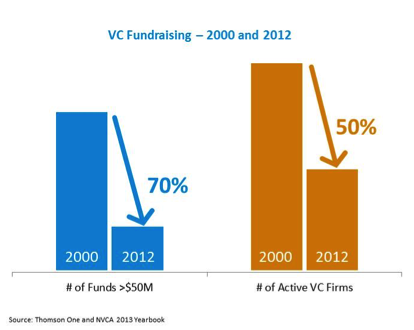
- Concentrated fund activity: The total number of venture funds greater than $50 million have dropped by 70% between 2000 and 2012. During the same period, the number of active firms dropped by 50%. Average fund sizes declined from $170 million (2000) to $140 million (2012). Upper quartile vintage returns are now trending towards 25% IRR.

- Stronger exit markets: Liquidity for venture investors has significantly improved since the 2008 financial crises. In 2012, 49 venture-backed IPOs Untitled4raised $21.5 billion. Between 2010-2012, 46 venture-backed IPOs raised over $1 billion each. The post-IPO valuation step-up is as high as 18X in the same time period, increasing returns for later stage venture capital funds as well. Similarly, in 2012, M&A activity generated $21.5 billion across 121 deals. The top 30 acquirers of technology companies, which include Google, Apple, and Cisco, have over $450 billion of cash on their balance sheets.
- Cash flow positive: As described earlier, the venture industry is net cash flow positive, a trend which is anticipated to continue over the coming years.
These three vectors – concentrated fund sizes, improved exit markets, and positive distributions create the possibility of improved returns for venture capital investors
Conclusion: Why VC? Why Now?
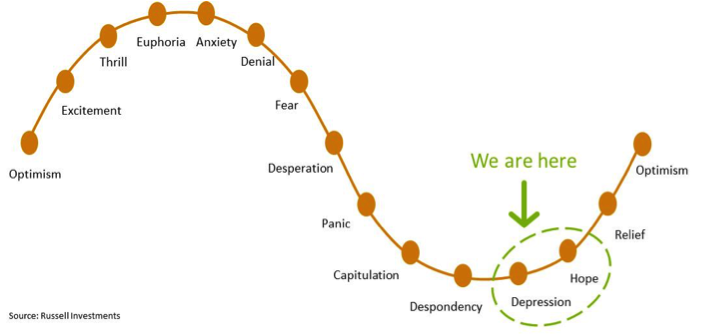
Critics of venture capital often fall prey to rearview mirror analysis, where past performance is seen as an indicator of the future. Over the past decade, institutional investors have moved steadily away from venture capital. The excesses of the 1999-2000 Dotcom Era coupled with the 2008 financial crisis created ongoing challenges for the industry. Returns plummeted and the pendulum swung to the other extreme as investors shied away. However, those who have stayed contrarian and consistent Untitled5have found that venture can generate meaningful returns. A more capital efficient startup universe, right-sized venture funds and strong public markets have the potential for superior returns. As we close out 2013, a strong year by several indices, market sentiment is healthy as returns are reverting to the mean. The three axes of innovation, capital flows, and liquidity are converging. This could create an environment conducive to generating attractive risk-adjusted returns. We believe the venture industry has recovered from an era of despondency to an era of hope.
Legal Disclosures
THE INFORMATION SET FORTH IN THIS DOCUMENT IS PROPRIETARY AND SHALL BE MAINTAINED IN STRICT CONFIDENCE. ANY REPRODUCTION OR DISTRIBUTION OF THIS DOCUMENT, IN WHOLE OR IN PART, OR THE DISCLOSURE OF ITS CONTENTS, WITHOUT THE PRIOR WRITTEN CONSENT OF TOP TIER CAPITAL PARTNERS, LLC (“TTCP”) IS PROHIBITED. THIS DOCUMENT WILL BE RETURNED TO TTCP UPON REQUEST.
CERTAIN FACTUAL STATEMENTS MADE HEREIN ARE BASED ON INFORMATION FROM VARIOUS SOURCES PREPARED BY OTHER PARTIES. WHILE SUCH SOURCES ARE BELIEVED BY TTCP TO BE RELIABLE, TTCP DOES NOT ASSUME ANY RESPONSIBILITY FOR THE ACCURACY OR COMPLETENESS OF SUCH INFORMATION.
RECIPIENTS OF THIS DOCUMENT ARE NOT TO CONSTRUE IT AS INVESTMENT, LEGAL OR TAX ADVICE, AND IT IS NOT INTENDED TO PROVIDE THE BASIS FOR THE EVALUATION OF ANY INVESTMENT. RECIPIENTS SHOULD CONSULT WITH THEIR OWN LEGAL, INVESTMENT, TAX, ACCOUNTING, AND OTHER ADVISORS TO DETERMINE THE POTENTIAL BENEFITS, BURDENS, AND RISKS ASSOCIATED WITH ANY TRANSACTION INVOLVING ANY TTCP-MANAGED INVESTMENT FUND OR ANY OTHER ISSUER REFERENCED HEREIN.
THIS DOCUMENT DOES NOT CONSTITUTE AN OFFER TO SELL OR THE SOLICITATION OF AN OFFER TO BUY ANY SECURITY; IT IS NEITHER A PROSPECTUS NOR AN ADVERTISEMENT, AND NO OFFERING IS BEING MADE TO THE PUBLIC. OFFERS TO SELL ANY INTEREST IN A TTCP-MANAGED INVESTMENT FUND SHALL BE PRECEDED BY DISTRIBUTION OF A PRIVATE PLACEMENT MEMORANDUM THE CONTENTS OF WHICH SHALL SUPERSEDE ANY INFORMATION PROVIDED HEREIN.
THE HISTORICAL PERFORMANCE ACHIEVED BY ANY PRIOR INVESTMENTS MADE BY THE TOP TIER FUNDS IS NOT A PREDICTION OF FUTURE PERFORMANCE OR A GUARANTY OF FUTURE RESULTS. THE INVESTMENTS MADE BY THE TOP TIER FUNDS INVOLVE A HIGH DEGREE OF RISK, INCLUDING THE LOSS OF ALL OR A PORTION OF THE PRINCIPAL INVESTED.
THE INFORMATION IN THIS DOCUMENT SHOULD NOT BE CONSIDERED A RECOMMENDATION TO PURCHASE OR SELL ANY PARTICULAR SECURITY. THERE IS NO ASSURANCE THAT ANY OF THE SECURITIES WILL REMAIN IN THE TOP TIER FUNDS’ PORTFOLIOS AT THE TIME YOU RECEIVE THIS REPORT.
INVESTMENTS NOTED IN THIS DOCUMENT REPRESENT ONLY A PORTION OF THE OVERALL INVESTMENTS MADE BY THE TOP TIER FUNDS AND THE VENTURE CAPITAL FUNDS IN WHICH THE TOP TIER FUNDS INVEST AND IN THE AGGREGATE MAY REPRESENT ONLY A SMALL PERCENTAGE OF ANY TOP TIER FUND’S PORTFOLIO HOLDINGS.
IT SHOULD NOT BE ASSUMED THAT INVESTMENTS MADE BY THE TOP TIER FUNDS AND THE VENTURE CAPITAL FUNDS IN WHICH THE TOP TIER FUNDS INVEST ARE PROFITABLE OR WILL BE PROFITABLE IN THE FUTURE. THE INVESTMENT PERFORMANCE OF COMPANIES SHOULD NOT BE CONSIDERED REPRESENTATIVE OF THE OVERALL PERFORMANCE OF THE TTCP FUNDS. ADDITIONAL INFORMATION REGARDING THE INVESTMENT PERFORMANCE OF COMPANIES IN THE TTCP FUNDS’ PORTFOLIO AS WELL AS OVERALL INVESTMENT PERFORMANCE OF THE TTCP FUNDS MAY BE OBTAINED BY CONTACTING THE PERSONS LISTED ABOVE.
Endnotes
Source: Cambridge Associates Venture Capital Index, which is an end-to-end calculation compiled from 1,347 U.S. venture capital funds formed between 1981 and 2011. It is a “dollar weighted” index that best represents the aggregate return of the entire venture industry.
Source: McKinsey Global Institute, All Tings Online, http://www.mckinsey.com/insights/mgi/in_the_news/all_things_online
Distributions were positive in 2008 but are not considered meaningful in context of 2011 and 2012 distributions.
Source: NVCA, Q3 2013 data
Source: Cambridge Associates Venture Capital Index, which is an end-to-end calculation compiled from 1,347 U.S. venture capital funds formed between 1981 and 2011. It is a “dollar weighted” index that best represents the aggregate return of the entire venture industry.
Source: http://en.wikipedia.org/wiki/Global_Internet_usage as of June 2013.
Source: PriceWaterHouse Coopers research http://www.pwc.com/gx/en/global-entertainment-media-outlook/data-insights.jhtml
Source: IDC market research estimates of cloud computing and application revenue estimates, as reported in http://www.idc.com/prodserv/FourPillars/Cloud/index.jsp
Source: http://www.forbes.com/sites/louiscolumbus/2013/12/03/idcs-top-ten-technology-predictions-for-2014-cloud-spending-will-exceed-100b/
Source: Comscore July 2013 data for US Subscribers: http://www.comscore.com/Insights/Press_Releases/2013/9/comScore_Reports_July_2013_U.S._Smartphone_Subscriber_Market_Share
Source: McKinsey Global Institute, Disruptive technologies: Advances that will transform life, business, and the global economy, May 2013
Source: http://techcrunch.com/2012/03/25/one-kings-lane-from-the-lax-arrivals-terminal-to-200m-in-revenue/
Source: http://techcrunch.com/2012/03/01/one-year-post-pivot-fab-com-is-on-track-to-100m-in-revenue-in-2012/
Source: http://finance.fortune.cnn.com/2013/11/14/why-the-tech-press-is-ignoring-zulily-ipo/
Source: As of Q2 2013 http://techcrunch.com/2013/10/19/airbnb-has-now-served-9m-guests-since-being-founded-up-from-4m-at-the-end-of-last-year/
Source: As of Q2 2013. http://www.forbes.com/sites/markrogowsky/2013/08/23/ubers-breathtaking-valuation-is-it-really-different-this-time/
Source: As of August 2013, http://techcrunch.com/2013/08/08/lyft-1m-dc/
Source: PriceWaterHouse Coopers research http://www.pwc.com/gx/en/global-entertainment-media-outlook/segment-insights/video-games.jhtml
LinkedIn IPO was completed in May 2011 at $4+ billion valuation and Twitter IPO was completed in Nov 2013 at $14+ billion valuation.
Source: http://www.nytimes.com/2012/11/04/education/edlife/massive-open-online-courses-are-multiplying-at-a-rapid-pace.html?_r=0
Source: NVCA Yearbook 2013/ThomsonOne. “Active” firms refer to venture groups actually investing $5 million or more in a given year.
Source: NVCA Yearbook 2013
Source: Thomson Reuters and NVCA *IPOS – Offer Amount; **M&A Deals with Disclosed Values
Source: Menlo Ventures analysis