PitchBook and the National Venture Capital Association recently released their half-year venture capital market trends report – the 2Q 2018 Pitchbook-NVCA Venture Monitor. In the report the two groups use their collective databases to break down industry statistics ranging from fundraising to valuations. We always find this report fascinating, as we have a unique position in the venture ecosystem (as LPs in venture capital funds, co-investors, and buyers of secondary LP positions). In this blog we will break down some of the 2Q 2018 findings and add some of our data to put it in context.
Investment Activity
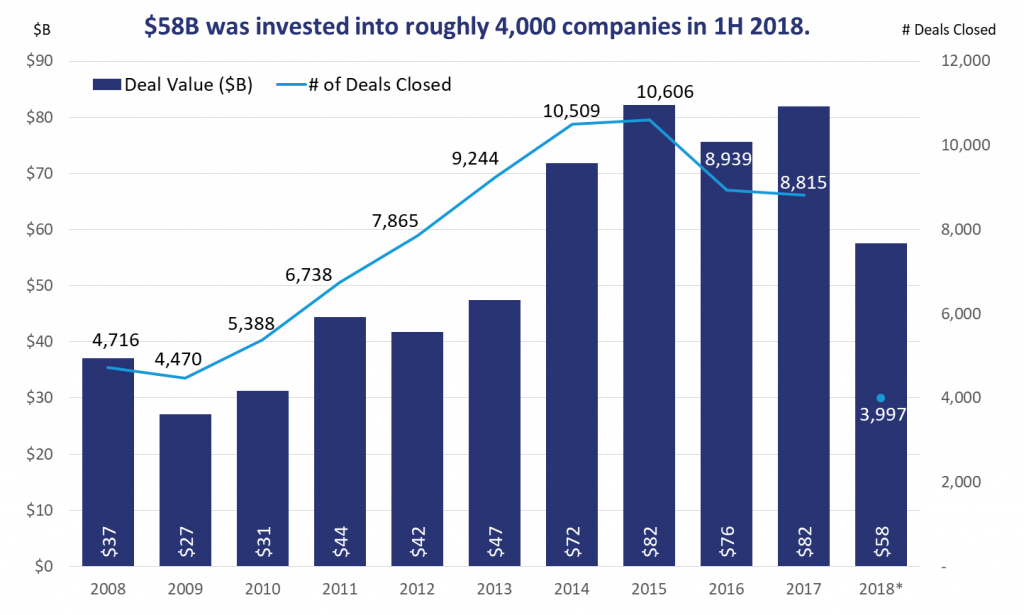
At the halfway point of the year, we continue to see an improved IPO market and record-high capital availability throughout the U.S. venture industry. According to a new report from PitchBook and the National Venture Capital Association, $57.5 billion was invested in venture-backed companies across roughly 4,000 deals in the first six months of 2018. To put this in perspective, this has exceeded the totals for any full year between 2008 and 2013. As we look into Top Tier specific investments, $203.3 million in capital was committed, which is also an increase from last year’s total of $127.3 million capital committed.

Source: Pitchbook Data, NVCA 2Q 2018 Venture Monitor. *As of June 30, 2018
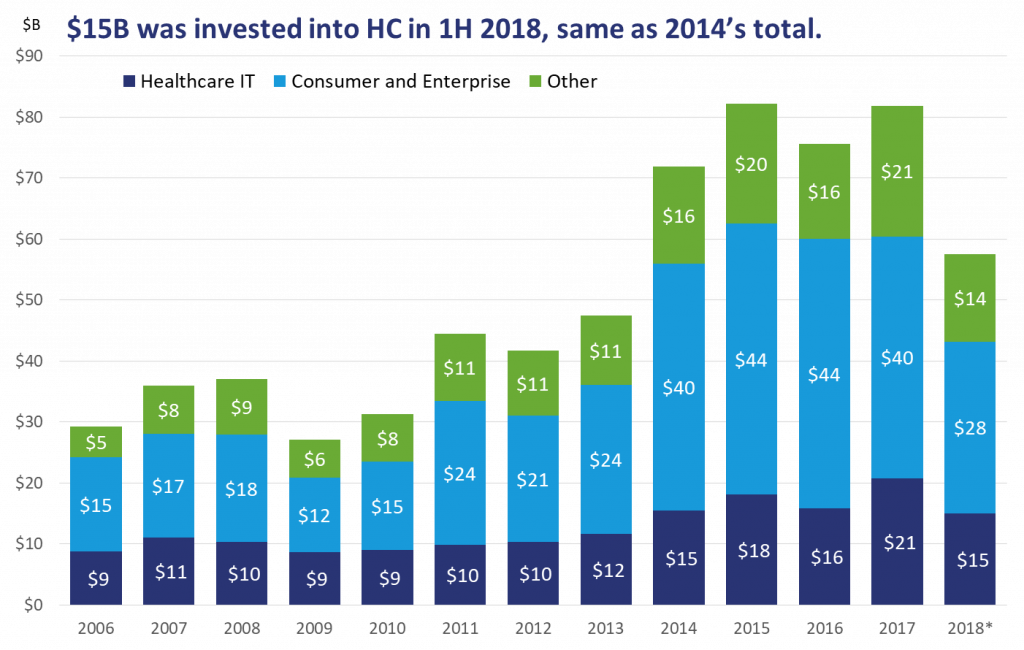
In our previous blog, we discussed why the healthcare sector continues to be an exciting area of focus for Top Tier. The Healthcare IT sector has continued to grow in the U.S. and about $15 billion has already been invested this year, the same amount as was invested throughout all of 2014. We believe that as pharmaceutical firms continue to reduce internal R&D spending and focus on acquiring promising new drugs, the healthcare space will continue to draw increased investment. Additionally, we expect to see new technologies like artificial intelligence and machine learning reshape health research and innovation going forward.


Source: Pitchbook Data, NVCA 2Q 2018 Venture Monitor. *As of June 30, 2018
Exit Activity
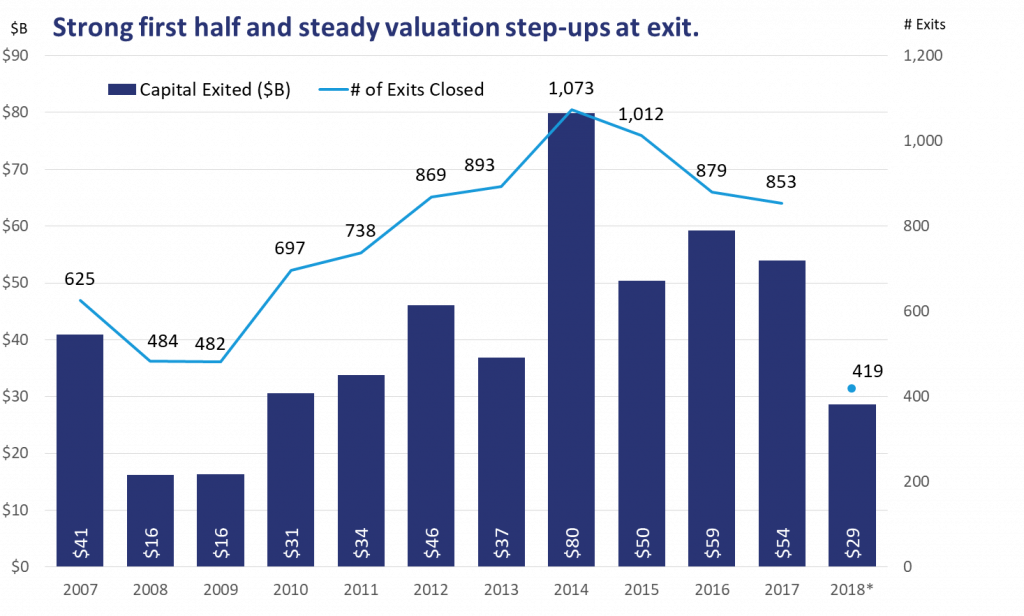
Although the number of exits overall has stayed low as compared to 2014, there has been an increase in the number of exits that have been completed this year as compared to last year. During the first half of the year, there were 419 venture-backed exits, which resulted in $28.7 billion of exit value, as compared to 348 exits and $25.2 billion of exit value in the same time period last year. The average time to exit closely matches last year’s level of around six years from the first venture capital funding a company raises. Positively, we have seen the IPO pipeline remain strong this year for enterprise software exits led by Dropbox ($756 million), DocuSign ($465.7 million), and Mercari ($496 million). The rising enterprise software IPOs have created optimism for the public market.


Source: Pitchbook Data, NVCA 2Q 2018 Venture Monitor. *As of June 30, 2018
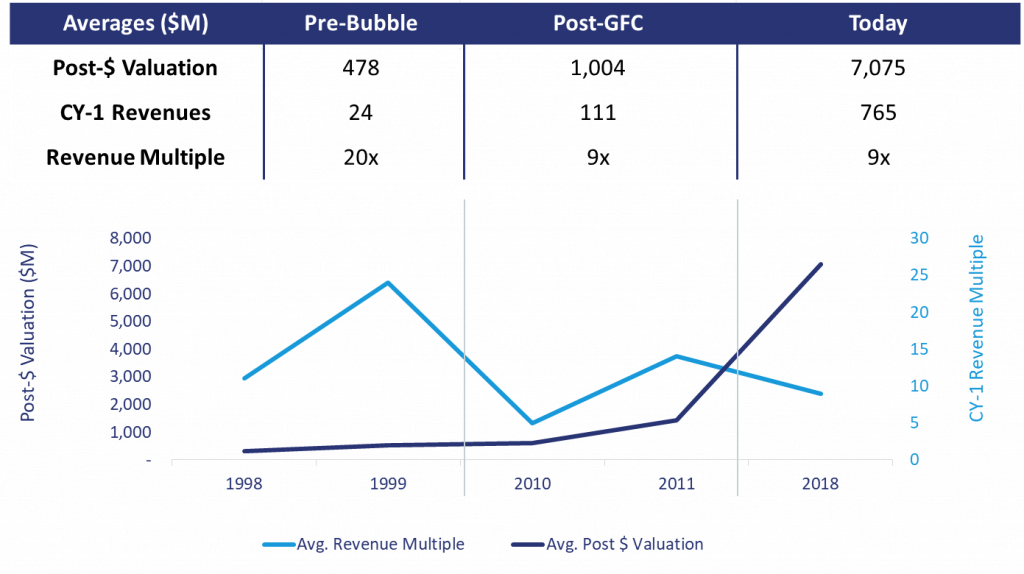
As companies have delayed IPOs and are staying private longer, the amount of late-stage capital being invested is increasing, and as such hold times and valuations continue to extend across the board, we believe the health of the exit market grows in importance. The chart below shows valuations and revenue multiples of IPOs across three periods in time. Here we see that the valuations of 2018 IPOs are not expensive in our estimation when taking into consideration the average revenue figures. If a company is growing at 30% year over year, our data shows that the company roughly doubles its valuation in 3 years. We believe that companies who delay exits for 3 years can assume same impact on valuation.


Source: The Mine database, as of 5/31/18. Pre-Bubble refers to 1998-1999. Post-GFC refers to 2010-2011.
Companies are staying private for longer than they have in the past, but the exit valuations are growing, which we believe in the end will make up for the delay. In our opinion, good things come to those who wait.
Please feel free to share all your comments and feedback. Follow @TTCP_SF for the latest updates and insights.
