For the past dozen years, Top Tier Capital Partners has believed that using data wisely can potentially help us to “see around corners”. Venture capital is an industry enshrouded in secrecy, making it difficult to determine what is happening in the world of private companies. The intersection between this part of the market and the public markets makes for interesting hypotheses.
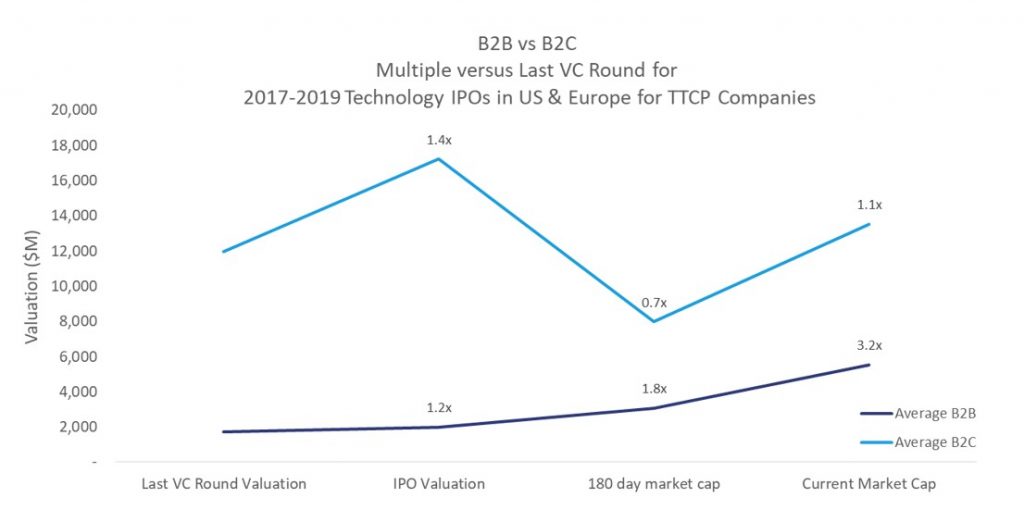
With the recent onslaught of IPOs, we started to see a trend emerge. It appeared that business to business (“B2B”) companies enjoyed stock price increases post-IPO, while business to consumer (“B2C”) companies were facing head winds. We went to the data and found that not only does this appear to be true, but the B2C companies actually revert back to the valuation of their last private round.
The data set is small, with only 32 technology IPOs in 2018 and 2019, but we found that while B2C companies enjoy higher valuations, the multiple between the last private round and the market cap at the end of the lock-up is 0.7x. This means the company valuation decreased 30%. The same methodology for B2B companies shows a multiple of 1.8x. As the below graphic shows, B2C companies bounce back a bit after the lock-up, but only to a valuation around that last private round.
There are a few reasons why this might be true. B2B companies typically have more stable revenues while B2C companies are more subject to consumer trends. Consumers are known to change their minds more often than businesses. Another potential reason is that consumer companies could face momentum or hype in the private markets due to their highly recognizable brands, thereby increasing valuations beyond what is typical in the pre-IPO stages. “Tourist investors” are also more apt to invest in consumer companies as shown by large investments in Uber, Lyft, Bird, and Airbnb.
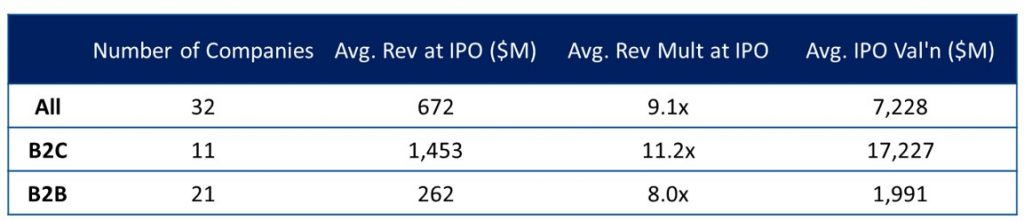
For this same data set, we found that the average revenue multiples are also more reasonable for B2B companies. An important note is that many venture backed companies are growing at incredibly high rates year-over-year and have significant revenues as shown below.
In the case of companies exiting via M&A during this same time period, the average acquisition price is $439 million for companies growing at an average annual rate of 56%. Yes, it takes a long 7 years, on average, to see these exits, but these are large companies which, a decade ago, were often public already. The interesting data point is that the IPOs in venture occur about 3 years later than M&A transactions, on average. If one were to take that $439 million valuation and grow revenues by 56% for each of the next 3 years, the same revenue multiple would drive a $1.7B valuation. There are always outliers, like many of the B2C companies, but if a company could add an additional 56% to their valuation by staying private and growing for another year, that is a good trade for all involved.
Nothing is ever straightforward in venture capital, but we found the results important as investors look to the late stages as a way to access venture capital innovation or a shorter time to exit. Being able to see around corners is a super power, and in this case, is one we will pay attention to as we invest in different stages of private companies.